The following is about how to build an elevation file to work with procedural-gl.js. I just really wanted to build my own elevation dataset and thought it would be helpful to share how I did it.
Procedural-gl.js has changed the game in attainable 3D online mapping. When I came across this project, I was very excited and wanted to get to mapping ASAP. There is so much potential in just a few lines of JS code; just add a base map, an elevation file and boom, you have a smooth functioning 3D map, mobile ready. I cannot thank Felix Palmer enough for putting this out there. You can check out the source code and some really great maps he developed here.
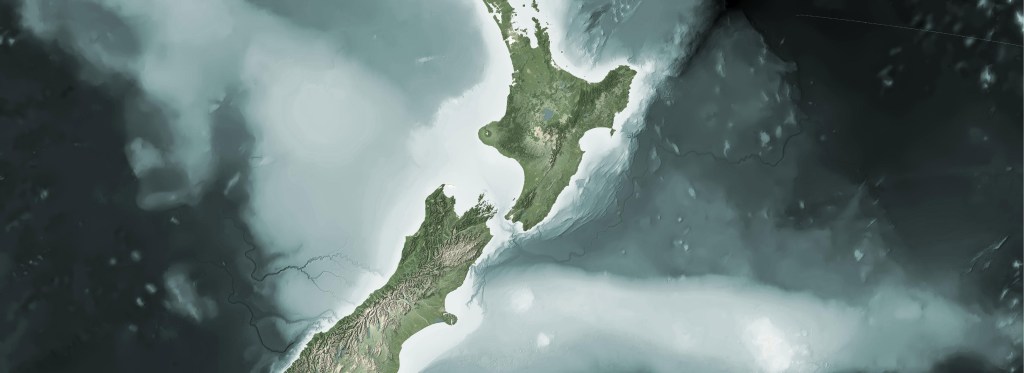
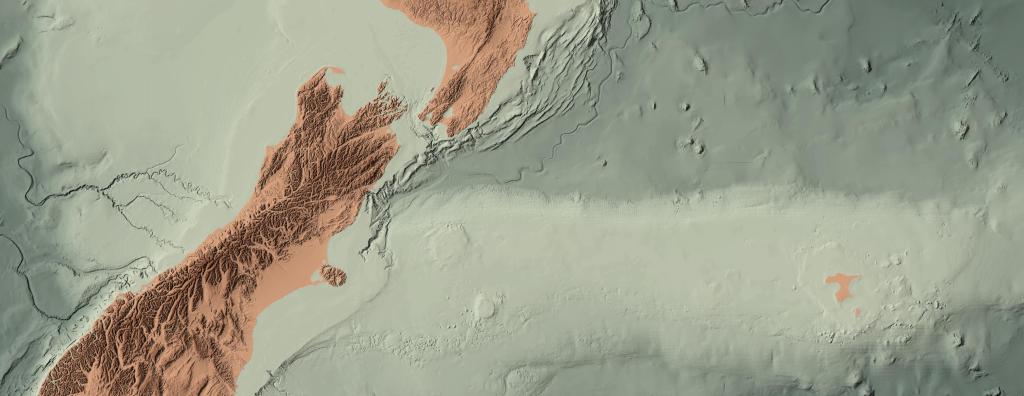
I’m not one to leave well enough alone. I wanted to develop a method to use New Zealand specific elevations with my goal being to eventually incorporate New Zealand’s LiDAR elevations. However, before I get to building elevation models for LiDAR, I wanted to test building an elevation model with the LINZ 8m DEM. This dataset covers the entire nation and was light weight enough to test on the ol’ home Linux box.
Method
As mentioned above, to run procedural-gl.js in its most basic form, you’ll need a tile cache for your base map and a tile cache for your elevation file. The base map I have covered, but I was unfamiliar for what was needed for the elevation tile cache. Fortunately, I came across SyncPoints tutorial on how to do this.
I am not going to rewrite their entire process. They did a really good job explaining the what, why, and how. Instead, I will layout what I did for the NZ specific data. Much of this process can be further refined and this is really just the proof of concept.
Two quick notes before I get started:
- For now, this process is only done in Web Mercator. I always want to push the limits and do my online work in NZTM, but for now, I am going to work with what I have.
- I am not going to talk about building a raster tile cache for the base map. I was fortunate to have a web mercator tile cache for NZ available.
We want to create an elevation file, in PNG rgb format, rendered into an XYZ tile cache directory, with 512x512px tiles.
The basic steps are this:
- Remove all errant noData pixels from a geotiff.
- Convert your elevation geotiff to rgb (single band to three band), in Byte format.
- Render your rgb geotiff into xyz raster tiles. Use a directory format.
- Consume through procedual-gl.js
List of Tools
Data
The data I used for this was the full LINZ 8m DEM elevation. Make sure your data is in Web Mercator projection (EPSG:3857). See some earlier blogs about how to retroject across all the tiles using BASH and gdalwarp.
Process
1. With the VRT, we can gather all the elevation tiles under one file name.
gdalbuildvrt elevation.vrt *.tif
2. Remove nodata
Using the VRT, we can preform the noData conversion across all the elevation tiles as if it were a mosaic. Better yet, the output from this command will produce a mosaic out the other side. GDAL is magic.
gdalwarp -t_srs EPSG:3857 -dstnodata None -co TILED=YES -co COMPRESS=DEFLATE -co BIGTIFF=YES elevation.vrt elevation_noData_mosaic.tif
3. RGB-ify the elevation mosaic.
rio rgbify -b -10000 -i 0.1 /elevation_noData_mosaic.tif elevation_noData_mosaic_rgb.tif
4. Create your XYZ tile cache in EPSG:3857
GDAL2Tiles is a quick way to render xyz tile caches if you have single layer and are working in Web Mercator. Be sure to use 3.1 or greater to get the functionality of xyz caching and tile size control. You need these both. In the end, I used the GDAL Docker developed by perrygeo, with modification, --with-python, and got access to GDAL 3.2. It was a lifesaver, however, I did need to modify the Dockerfile to add GDALs Python bindings and rebuild the Docker.
gdal2tiles.py --s_srs=EPSG:3857 --zoom=0-16 --xyz --tilesize=512 --processes=7 elevation_noData_mosaic_rgb.tif /data/tile-cache
Localhost Testing
Once I built the tile cache, I built a quick site on my localhost to test. I embedded the tile cache into the site (place the tile cache in the same directory as your web files), then I ran it under a local server. The advantage of embedding your tile cache for testing is that it allows the local server to serve out the raster tiles as well. There is no need to set up a tile server. The local server does this for you.
I switched it up this time used the npm http-server to avoid some cors issues I was encountering.
http-server . —cors 8000
Code and Website
You can view the code for the HTML and JS here:
https://github.com/xycarto/3D_Aotearoa/
The running website can be found here:
https://xycarto.github.io/3D_Aotearoa/
It works great on mobile devices, but will happily display on your desktop.