This post covers loading a raw COG Tif and manipulating the values in JS. If you are unfamiliar with the COG Tif format, see here for an explanation. Openlayers has a few good examples on how to load COGs. Some of this is a repeat of their examples and some goes a little more in depth.
- Example site is running here
- Github repo is here
The following will cover:
- Loading a COG via Openlayers 6
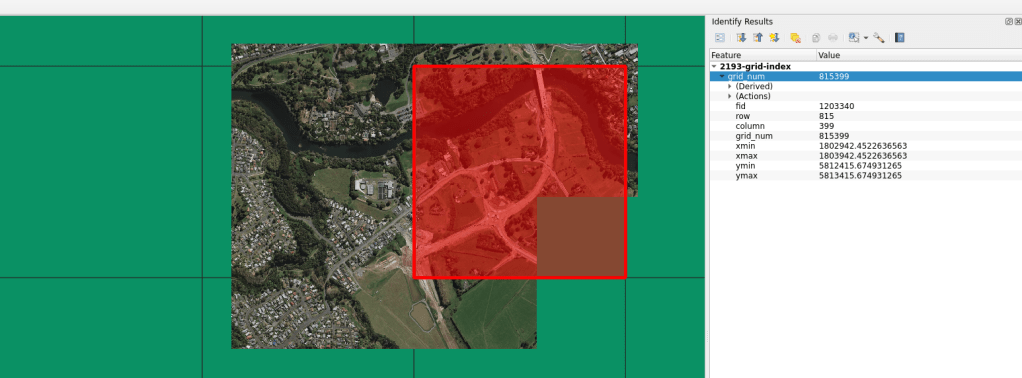
- Demonstration of a pop-up to query the COG value
Data in the site:
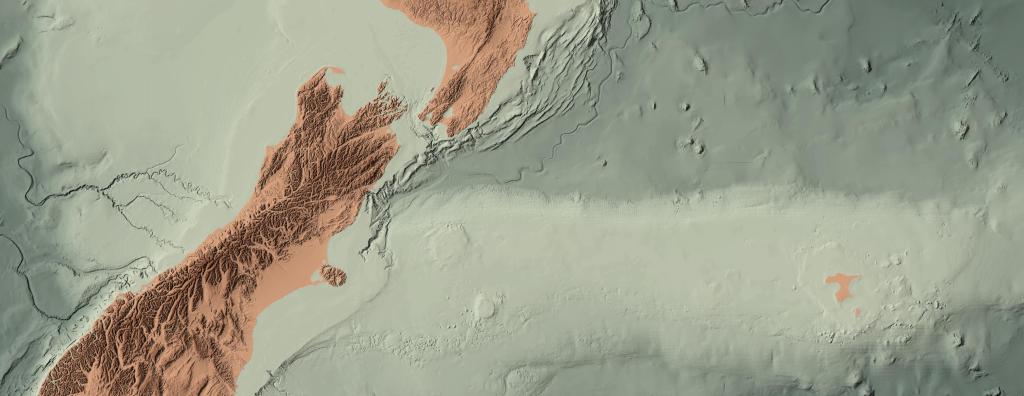
- Sea Surface Temperature (SST) from JPL. Clipped to New Zealand EEZ
- LINZ Aerial Imagery Basemap. The link is temporary. I highly suggest you get your own link from here.
Few Notes:
- The COG and the website are built using WEB MERCATOR projection, so there are no special steps to build the site with regards to projection
- I am only covering the JS in this example, see here for a full HTML/CSS/JS example, you can look here
Creating the COG
There are many tutorials out there on creating a COG. I am not going to repeat these. Instead, I am providing a link to a COG I created. The COG used in this example was created using a standard python build like:
creation_options = [
    "BIGTIFF=YES",
    "BLOCKSIZE=512",
    "RESAMPLING=BILINEAR",
    "COMPRESS=DEFLATE",
    "NUM_THREADS=ALL_CPUS"
]

gdal.Translate(
    "clipped-eez-nztm-20200101090000-JPL-L4_GHRSST-SSTfnd-MUR-GLOB-v02_fill_cut_warp_cog.tif",
    “warp_anti.tif”,
    format = "COG",
    callback=gdal.TermProgress_nocb,
    creationOptions = creation_options
)
I put the COG on S3 and made the link public
'https://d3cywq4ybqu7io.cloudfront.net/cogs/sst/clipped-eez-nztm-20200101090000-JPL-L4_GHRSST-SSTfnd-MUR-GLOB-v02_fill_cut_warp_cog.tif'Loading a raw COG tif
First, set the url to the COG and load it as a source:
var urls3 = 'https://d3cywq4ybqu7io.cloudfront.net/cogs/sst/clipped-eez-nztm-20200101090000-JPL-L4_GHRSST-SSTfnd-MUR-GLOB-v02_fill_cut_warp_cog.tif'

var cogSource = new ol.source.GeoTIFF({
    normalize: false,
    sources: [
        {
        url: urls3,
        min: 277,
        max: 300,
        nodata: -32768,
        },
    ],
    });
Here, we set the min/max of the value from the COG.
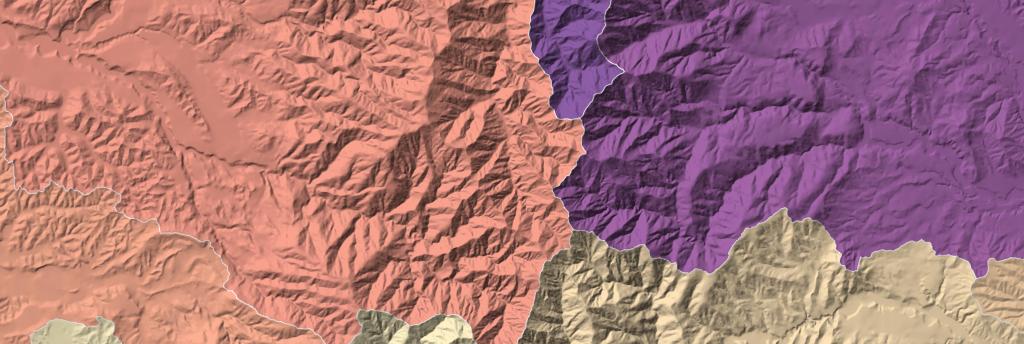
Second, we build the colour gradient for the COG. This will tell the client how to colour the values of the COG:
var cogBand = ['band', 1]

var defaultColor = {
color: [
    'interpolate',
    ['linear'],
    cogBand,
    276.9, [255, 255, 255, 0],
    277, [19, 22, 180, 1],
    284, [70, 111, 207, 1],
    289, [196, 229, 183, 1],
    294, [217, 164, 73, 1],
    300, [199, 69, 40, 1]
],
};
Here, we are using a linear interpolation to create a smooth gradient between the values.
Third, load the COG with colorization:
var cog = new ol.layer.WebGLTile({
    visible: false,
    crossOrigin: 'anonymous',
    source: cogSource,
    style: defaultColor,
    })
Here, the visibility is set to ‘false’. When the map initializes on the browser, I want it turned off at the start to allow users to toggle the layer on/off.
Setting up the query button
This is a standard pop-up button from Openlayers. It is developed so users can query the SST map and see the actual value at that location. You’ll need to do some work in the HTML and CSS. See here for more detail in the code:
First, build the pop-up in the JS at the top of the file:
// Pop up set
var container = document.getElementById('popup');
var content = document.getElementById('popup-content');
var closer = document.getElementById('popup-closer');

var overlay = new ol.Overlay({
    element: container,
    autoPan: {
      animation: {
        duration: 250,
      },
    },
  });

closer.onclick = function () {
overlay.setPosition(undefined);
closer.blur();
return false;
};
Second, set the pop-up to query the COG layer:
// Set onclick to return values from COG
map.on('singleclick', function(evt) {
    var coordinate = evt.coordinate;
    var data = cog.getData(evt.pixel);
    console.log(data[0])
    var celcius = data[0] - 273.15
    var codeText = "Temp in Celcius"
    content.innerHTML = "<div class='popupText'>Sea Surface Temperature: <strong>" +
        celcius.toFixed(2) + "</strong><div class=returnVal>" + codeText + "</div></div>";
    overlay.setPosition(coordinate);
  })
Those are the main bits. The remainder of the code in the JS is setting up a base map, building the toggle button, and preparing the query pop-up.
Of course, you can clone the repo and do what you like to make it your own special site.
As usual, this example is only one way to do this. There are many other setups and special circumstances that will negate what is shown here.
Let me know if this this helped or if you have questions. Also, if you used this, I’d love to see what you built!