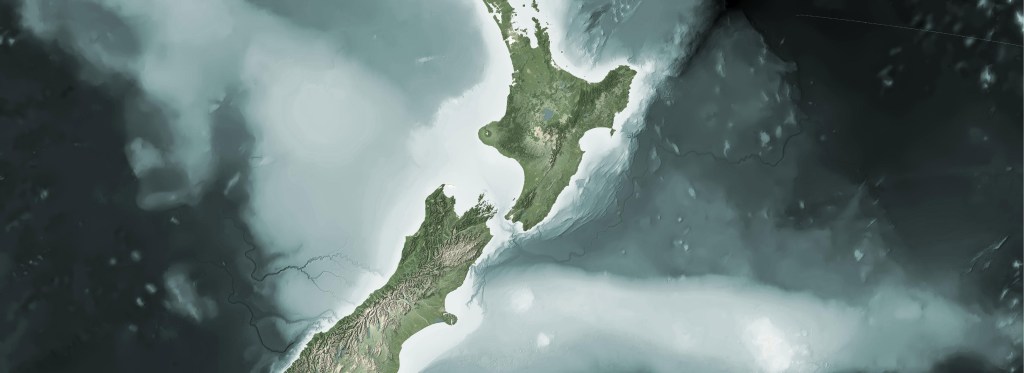
As interest in LiDAR derived elevation increases, so grows the interest in the capabilities. LiDAR derived elevation data has been great for my visualization game and in helping me communicate the story out about what LiDAR can do. It all starts with a picture to get the imagination going.
The Wellington model derived for this project is part of an ongoing project to help increase the exposure of the Wellington 1m DEM/DSM elevation data derived from LiDAR. Step one for me is getting a working model built in QGIS, capturing still images, and increasing interest in the data.
I’ve talked about the processing of the elevation data for Wellington visualizations in the past, so for this post I’m only focusing on the blending of the data sets in building the model. This project is a good model since it encompasses a number of subtle techniques to get the model to stand out. This post is one of a two part series; the second post discusses the techniques used to derive and visualize the bathymetry for the surrounding harbor.
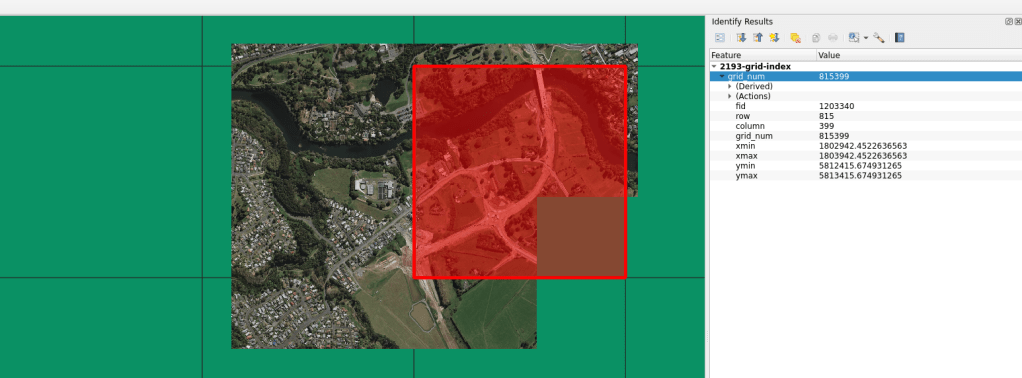
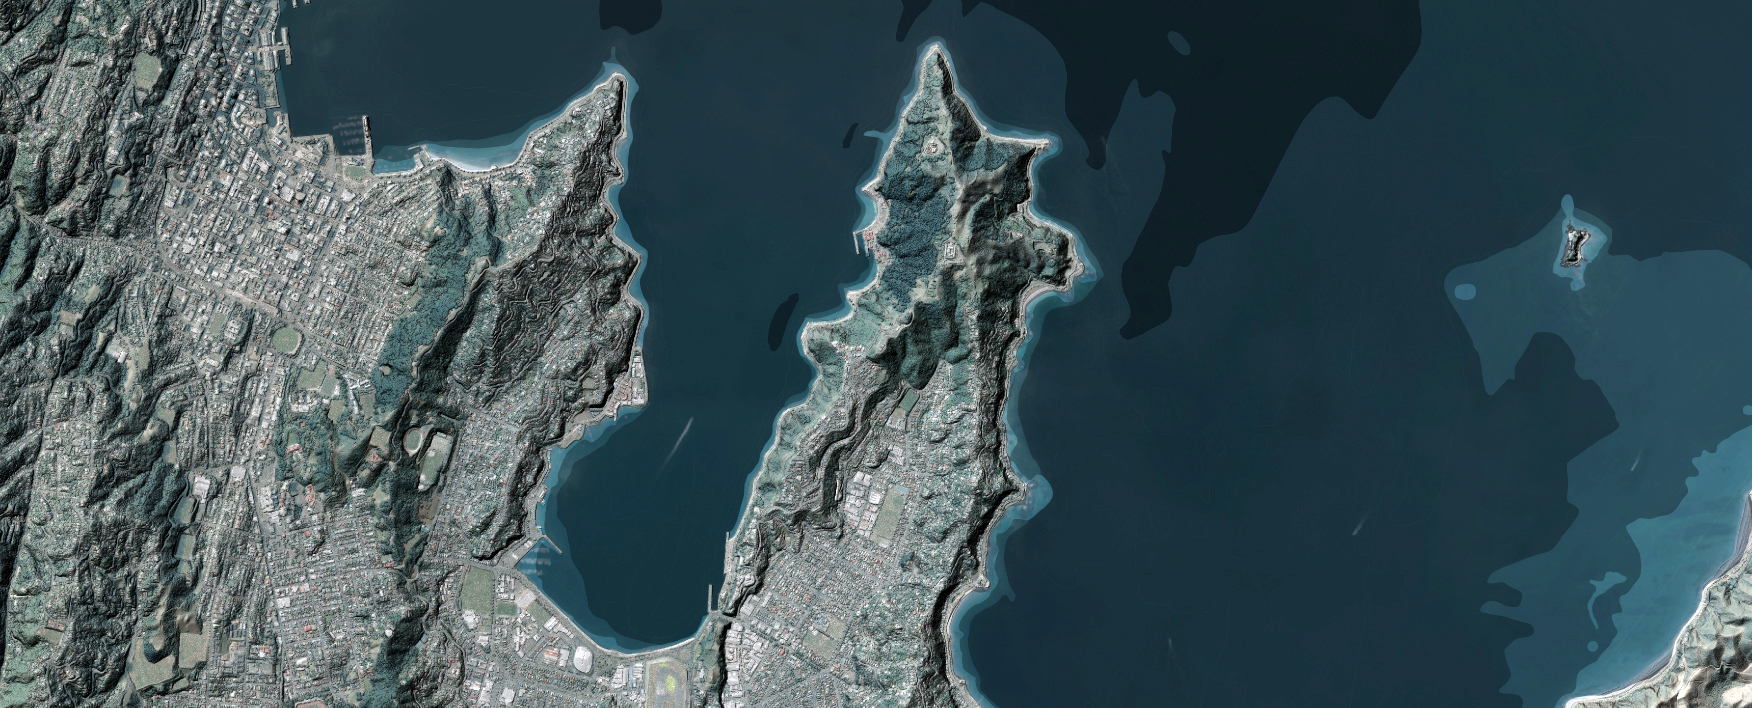
Let’s start with the base, Aerial Imagery.

Blended with a hillshade
DSM added for texture and context

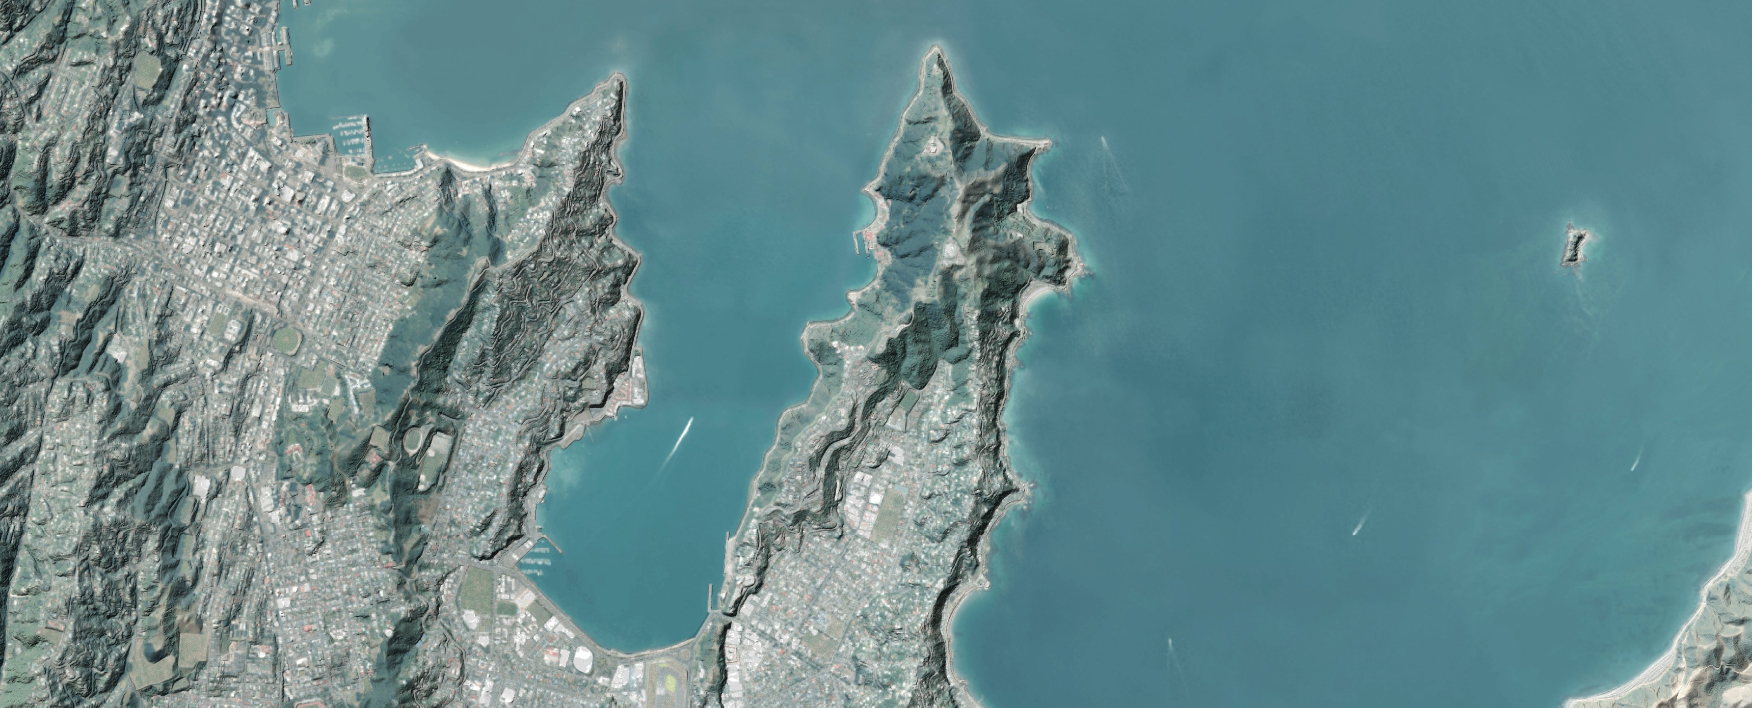
Slope added to define some edges
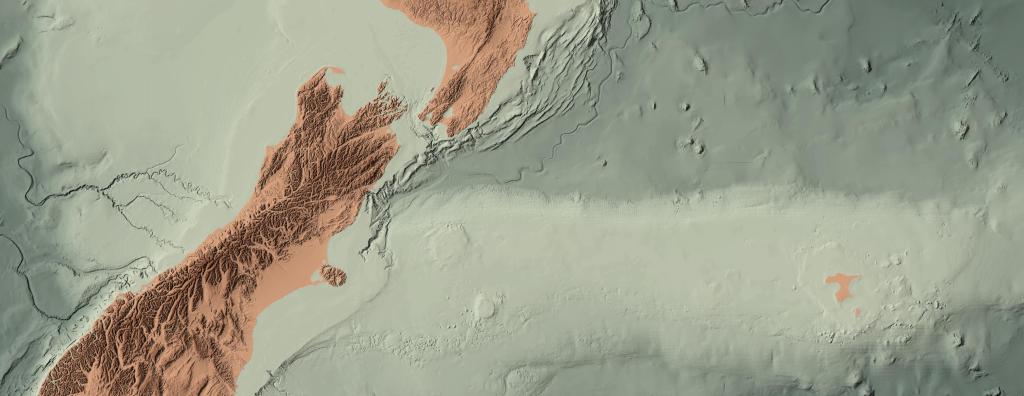
Some darker shading added to the bathymetry to frame the elevation data

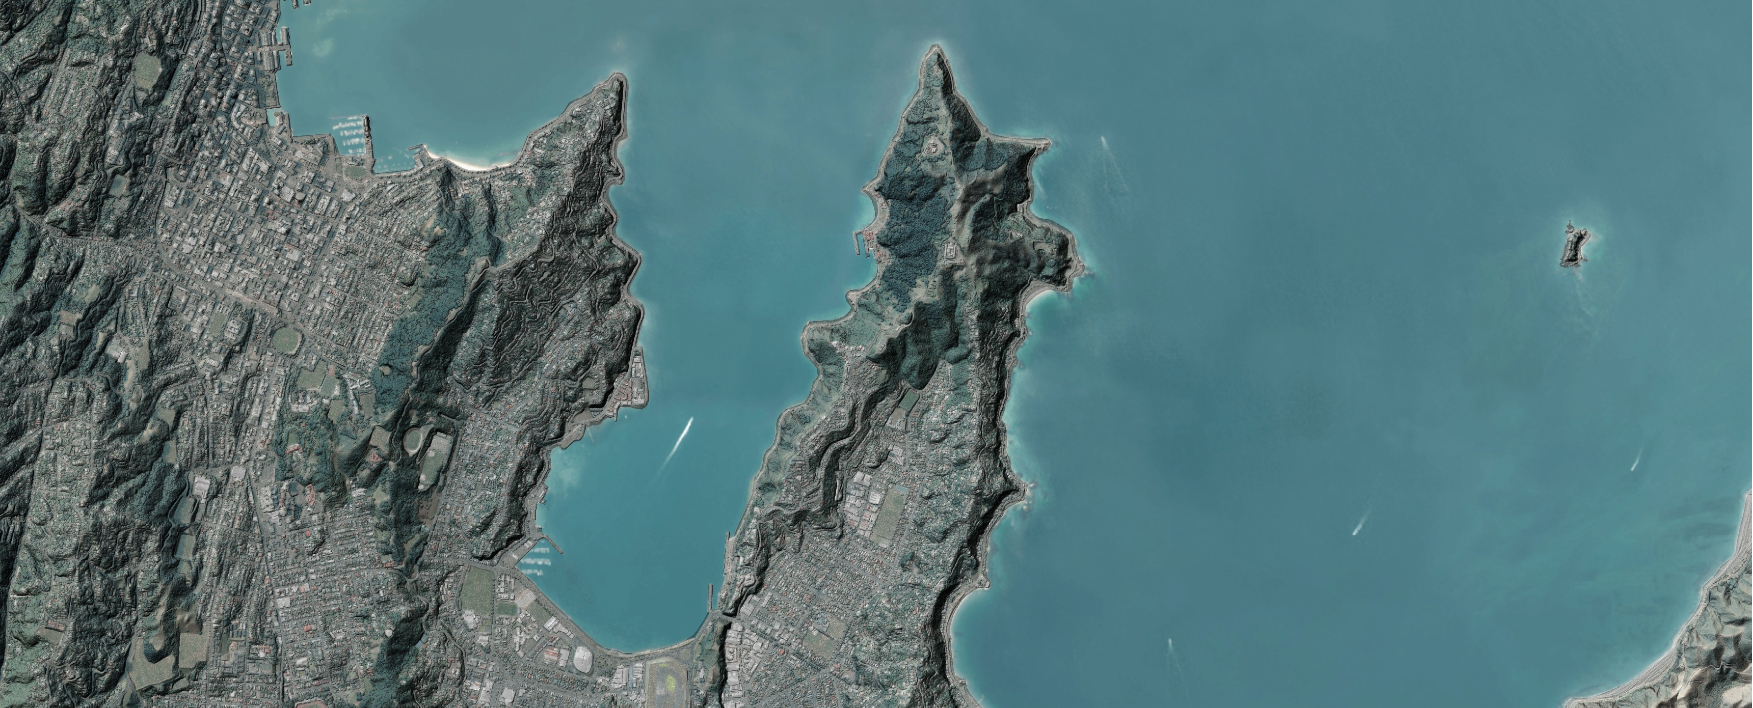
And finally some added bathymetry to lighten the edges at the shoreline enhancing the frame a bit more.

In the end there is some post-processing in Photoshop to lighten up the image. Honestly, this could have been done in QGIS, but I was being lazy. For the images produced, there was no need to retain the georeferencing, and when that is the case, I rely on Photoshop for color and light balancing.
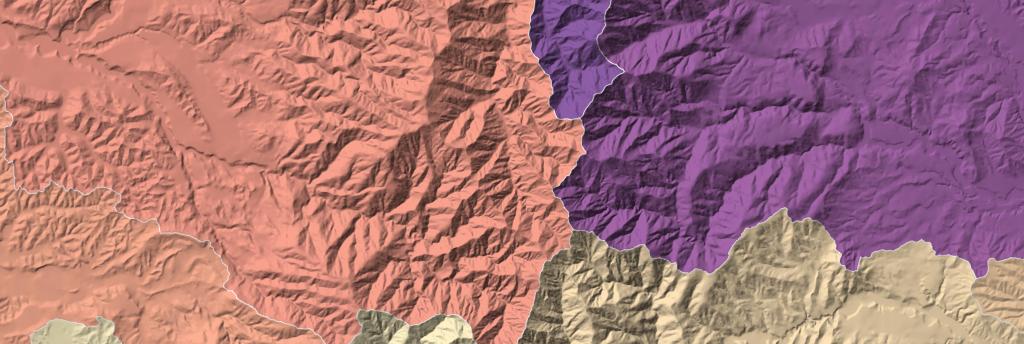
The greatest difficultly in this project so far has been trying to create a universal model for the data set. I’m finding that as I visualize different regions using this model, I need to adjust the hillshading quite significantly to draw out different features. Take a look at the images here. It is the same model, but with the noticeably different gradients used in the hillshades. The techniques used for the images in this post worked well for the urban region shown, but fall apart as you move further out into the more mountainous regions. Much of the blending is too harsh and turns the mountains into a black muddled mess. I am almost there, but like any project, it takes a good bit of subtle tweaking of the blending to get a universal image to work.
The entire base mapping work is completed in QGIS. The elevation data was processed using GDAL and the bathymetric interpolations were produced SAGA GIS. There are no color palettes for this project. The aerial imagery does all the work in that department.
Base data can be found here:
DEM: https://data.linz.govt.nz/layer/53621-wellington-lidar-1m-dem-2013/
DSM: https://data.linz.govt.nz/layer/53592-wellington-lidar-1m-dsm-2013/
Aerial Imagery: https://data.linz.govt.nz/layer/51870-wellington-03m-rural-aerial-photos-2012-2013/
The next post covers the development of the bathymetry for the surrounding harbor. Thanks for having a look and let me know what you think.
Note: All imagery was produced during my time at Land Information New Zealand. Imagery licensing can be found here:
“Source: Land Information New Zealand (LINZ) and licensed by LINZ for re-use under the Creative Commons Attribution 4.0 International licence.”