
Category: cartography
-
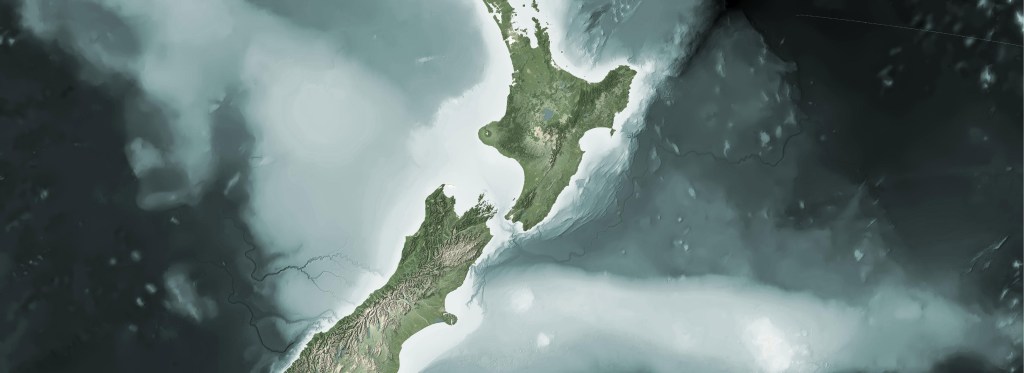
Cartographic Aotearoa
I try hard to keep this blog about basic open source processing in GIS. I don’t spend much time talking about my cartographic work, since I like put it up in the gallery and try to let it speak for itself. Further, 90% of my cartographic products involve processing data before it ever gets to…
-
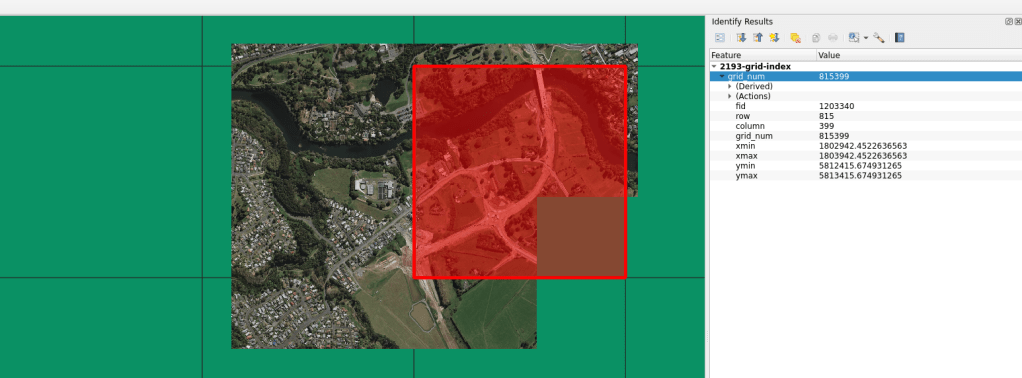
Projection Grid
There are times when I need a regular grid for an entire projection extent. Meaning, for the extent of an entire projection, I need to create a regular grid of uniform tiles across the projection. In past projects, these grids have been very helpful for data alignment and clipping data into uniform shapes and sizes.…
-

Basic COG in Openlayers: Single Band Tif
This post covers loading a raw COG Tif and manipulating the values in JS. If you are unfamiliar with the COG Tif format, see here for an explanation. Openlayers has a few good examples on how to load COGs. Some of this is a repeat of their examples and some goes a little more in…
-
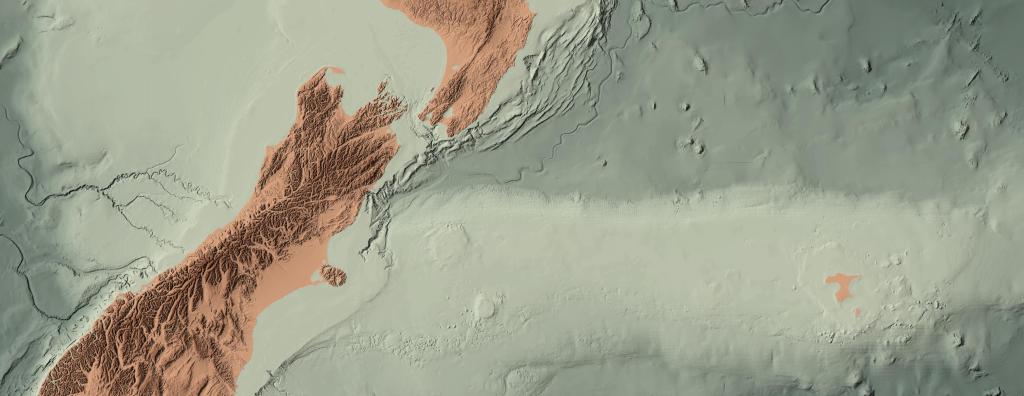
Warping Across Anti-meridian: NZTM to Web Mercator
TL;DR Python example here. Git repo updated 13 Feb 2024. NZTM to Web Mercator There are a number of times when I am building a web map when I need to warp a GTiff across the anti-meridian. New Zealand sits at the edge of this line, with a portion of it on the other side,…
-

Wellington Elevations: Interpolating the Bathymetry
It is important to note something from the very beginning. The interpolated bathymetry developed in this project does not reflect the actual bathymetry of the Wellington Harbour. It is my best guess based on the tools I had and the data I worked with. Furthermore, this interpolation is NOT the official product of any institution.…
-

Building the Wellington Model with 1m DEM and DSM
As interest in LiDAR derived elevation increases, so grows the interest in the capabilities. LiDAR derived elevation data has been great for my visualization game and in helping me communicate the story out about what LiDAR can do. It all starts with a picture to get the imagination going. The Wellington model derived for this…
-

The Rejects
Sometimes there is simply not enough room for all the ideas. Sometimes you want all the images to make it to the final round. In a recent project to promote some of our elevation data, I was asked to present a number of ideas for a 2000mm x 900mm wall hanging. The piece was to…
-

Processing and Visualizing Auckland 1m DEM/DSM Elevation Data
About two years ago, I took on a cartographic project visualizing the Auckland 1m DEM and DSM found publicly via the LINZ Data Service (LDS) here: DEM, DSM. The goal at the time was to develop a base map for the extraction of high resolution images for use in various static media. It was a…

